
Direct answer: develop a stream-by-stream water balance, measure each discharge's timing and flow, and pair flow with representative concentration data to calculate kg/day. Design for both hydraulic peaks and pollutant mass peaks. Confirm direct or indirect discharge requirements before selecting treatment, and control product loss at source before paying to remove it from wastewater.
Who uses this planning method?
Factory owners and planners
Screen site utility, sewer, pretreatment and capital requirements before layout freeze.
Environmental engineers
Build the design basis for screening, equalization, physical-chemical and biological treatment.
Production and sanitation teams
Link product loss, cleaning practice and batch dumps to wastewater loading.
Compliance teams
Align sampling, records and discharge controls with the receiving authority and permit.
The formulas used by the estimator
Wastewater flow (m3/day) = total factory water use x wastewater discharge fractionPollutant load (kg/day) = concentration (mg/L) x wastewater flow (m3/day) / 1,000Annual wastewater volume (m3/year) = wastewater flow x operating days/yearThe simple discharge fraction supports early screening. It assumes the entered concentrations represent the calculated combined wastewater flow on the same daily basis. It does not model peak flow, stormwater, sanitary sewage, evaporation, product incorporation, separate cooling water or water reuse.
Worked example: concentration becomes mass load
A factory uses 120 m3/day and estimates 85% becomes process wastewater. Representative combined wastewater data are COD 2,200 mg/L, BOD 1,100 mg/L, TSS 650 mg/L and FOG 300 mg/L. It operates 250 days/year.
- Wastewater flow = 120 x 0.85 = 102 m3/day.
- COD load = 2,200 x 102 / 1,000 = 224.4 kg/day.
- BOD load = 112.2 kg/day.
- TSS load = 66.3 kg/day.
- FOG load = 30.6 kg/day.
- Annual wastewater volume = 102 x 250 = 25,500 m3/year.
A single grab sample cannot establish that these are representative daily loads.
Concentration and mass answer different questions
| Measure | Primary use | Failure if used alone |
|---|---|---|
| Concentration, mg/L | Permit limits, process conditions and treatment influent strength. | Dilution can reduce mg/L without reducing pollutant mass. |
| Mass load, kg/day | Biological, chemical, sludge and surcharge planning. | Daily mass can hide a short toxic or hydraulic slug. |
| Average flow, m3/day | Long-term balance, storage and operating cost. | Does not size channels, pumps or batch receiving. |
| Peak flow, m3/h or L/s | Hydraulics, equalization, screening, drains and pumps. | Does not define treatment mass or annual volume. |
| Variability | Equalization, process control, redundancy and sampling. | An average design may fail during product change or sanitation. |
Build a complete water balance
Replace the estimator's percentage with measured or calculated streams as the project develops:
Water in = product/ingredient water + utility makeup + cleaning + process + domestic + rainfall/infiltration where applicableWater out = product + evaporation/exhaust + reuse/export + process wastewater + sanitary + stormwater + sludge/solids moistureSeparate clean non-contact cooling water, sanitary sewage and stormwater from high-strength process wastewater where permitted and beneficial. Cross-connections can create both compliance and food-hygiene risks.
Develop a discharge timeline
List continuous streams and every batch event with volume, duration, frequency and composition. Typical food-factory peaks include cooker or blancher dumps, CIP tank drains, COP changes, brine disposal, defrost, floor sanitation, product changeovers and accidental product loss.
Use the timeline to identify maximum minute/hour flow, maximum mass-load period and incompatible combinations. A low average flow with two simultaneous tank dumps can overwhelm a drain, screen, lift station or pH-control system.
Sampling must match the decision
| Sampling approach | Suitable purpose | Important limitation |
|---|---|---|
| Grab sample | Short event, pH, temperature, FOG layer or specific batch condition. | May not represent daily average loading. |
| Time composite | Characterizing a relatively stable flow over time. | Can bias load when flow varies significantly. |
| Flow-proportional composite | Average concentration and mass loading across variable flow. | Needs reliable flow measurement and suitable preservation. |
| Event sample | CIP dump, product spill, start-up or worst-case recipe. | Must not be mixed into an average without preserving its slug risk. |
Define location, collection period, preservation, holding time, laboratory method, detection limit and quality control. In the United States, 40 CFR Part 136 contains approved test procedures for Clean Water Act programs; the permit or control authority determines the applicable methods.
Parameters beyond the calculator
COD, BOD, TSS and fats-oils-grease are useful starting parameters, but treatment and permits may also require:
- pH, temperature, conductivity, salinity and alkalinity.
- Total Kjeldahl nitrogen, ammonia, nitrate and phosphorus.
- Settleable solids, particle size and volatile/fixed solids.
- Surfactants, sanitizers, oxidants and cleaning chemicals.
- Chloride, sulphate, sodium or brine-specific constituents.
- Toxicity, metals or product-specific compounds where relevant.
- Biodegradability, oxygen uptake and nutrient balance for biological treatment.
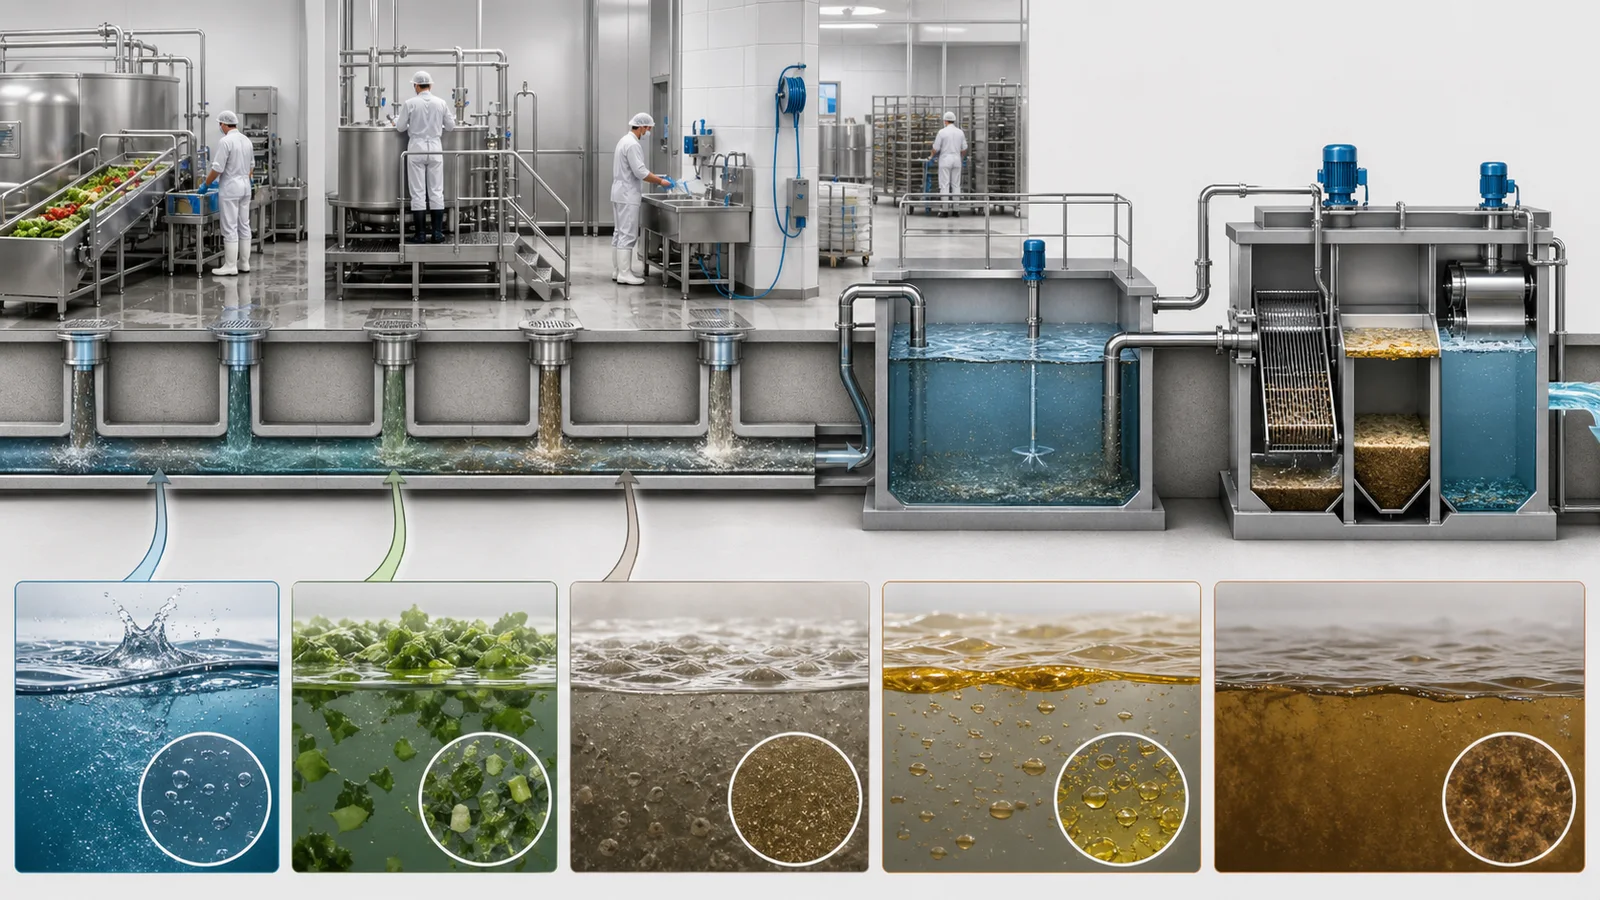
Source reduction before end-of-pipe treatment
- Prevent overfill, leaks, spills and off-spec product.
- Recover edible product or by-product before it reaches the drain.
- Use dry pickup and screening before washdown where hygienically suitable.
- Segregate concentrated first rinses, brines, fats and chemicals for targeted handling.
- Optimize cleaning sequence, flow and water-on time without weakening hygiene.
- Control chemical concentration and automatic dosing failures.
- Meter high-load processes and investigate abnormal loads by event.
Water reduction can raise concentration while reducing total hydraulic flow. Evaluate both kg/day and mg/L to avoid shifting the problem.
Pretreatment functions to evaluate
Treatment selection follows characterized wastewater and required effluent, not a generic food-factory flow diagram. Potential functions include:
Headworks
Coarse/fine screening, solids capture, grit and protected pumping.
Equalization
Flow and load buffering, mixing, odour control, level management and emergency hold.
Physical-chemical
pH control, coagulation/flocculation, dissolved-air flotation and FOG/solids separation.
Biological
Organic and nutrient removal under controlled loading, oxygen, temperature and sludge age.
Polishing or reuse
Filtration, membranes, disinfection or other barriers driven by discharge/reuse quality.
Residuals
Captured product, screenings, float, biological sludge, dewatering and disposal route.
Equalization is not just tank volume
Define the inflow hydrograph, controlled outflow, required operating level, emergency volume and mixing. Check odour, gas, corrosion, foam, solids settling, cleanability, confined-space risk, overflow, bypass and standby pumping. Equalization can smooth flow and load but does not remove pollutant mass.
Direct and indirect discharge
In the United States, EPA effluent guidelines establish national technology-based standards for listed industrial categories. Indirect dischargers to a publicly owned treatment works are also subject to the National Pretreatment Program, including applicable general/specific prohibitions, categorical standards and local limits. Industrial users have monitoring, reporting and recordkeeping responsibilities.
Other countries have different systems. Identify receiving route, authority, permit, industry category, production basis, averaging period, local surcharge and prohibited discharges before design. Never copy numerical limits from another factory.
Food-hygiene and drainage interface
Codex CXC 1-1969 requires drainage and waste-disposal systems that avoid contaminating food or water supplies. Keep wastewater movement from less-clean areas from creating risk in cleaner areas. Coordinate floor falls, channels, drain seals, air breaks, backflow, maintenance access, pest control and overflow paths with the hygienic zoning plan.
Ten-step wastewater planning workflow
- Confirm discharge routes and authorities. Direct, municipal, hauled, reused or segregated streams.
- Create the water balance. Measure or calculate every significant input and output.
- Map discharge events. Flow, duration, recipe, cleaning stage and frequency.
- Install representative flow measurement. Match meter range and location to the stream.
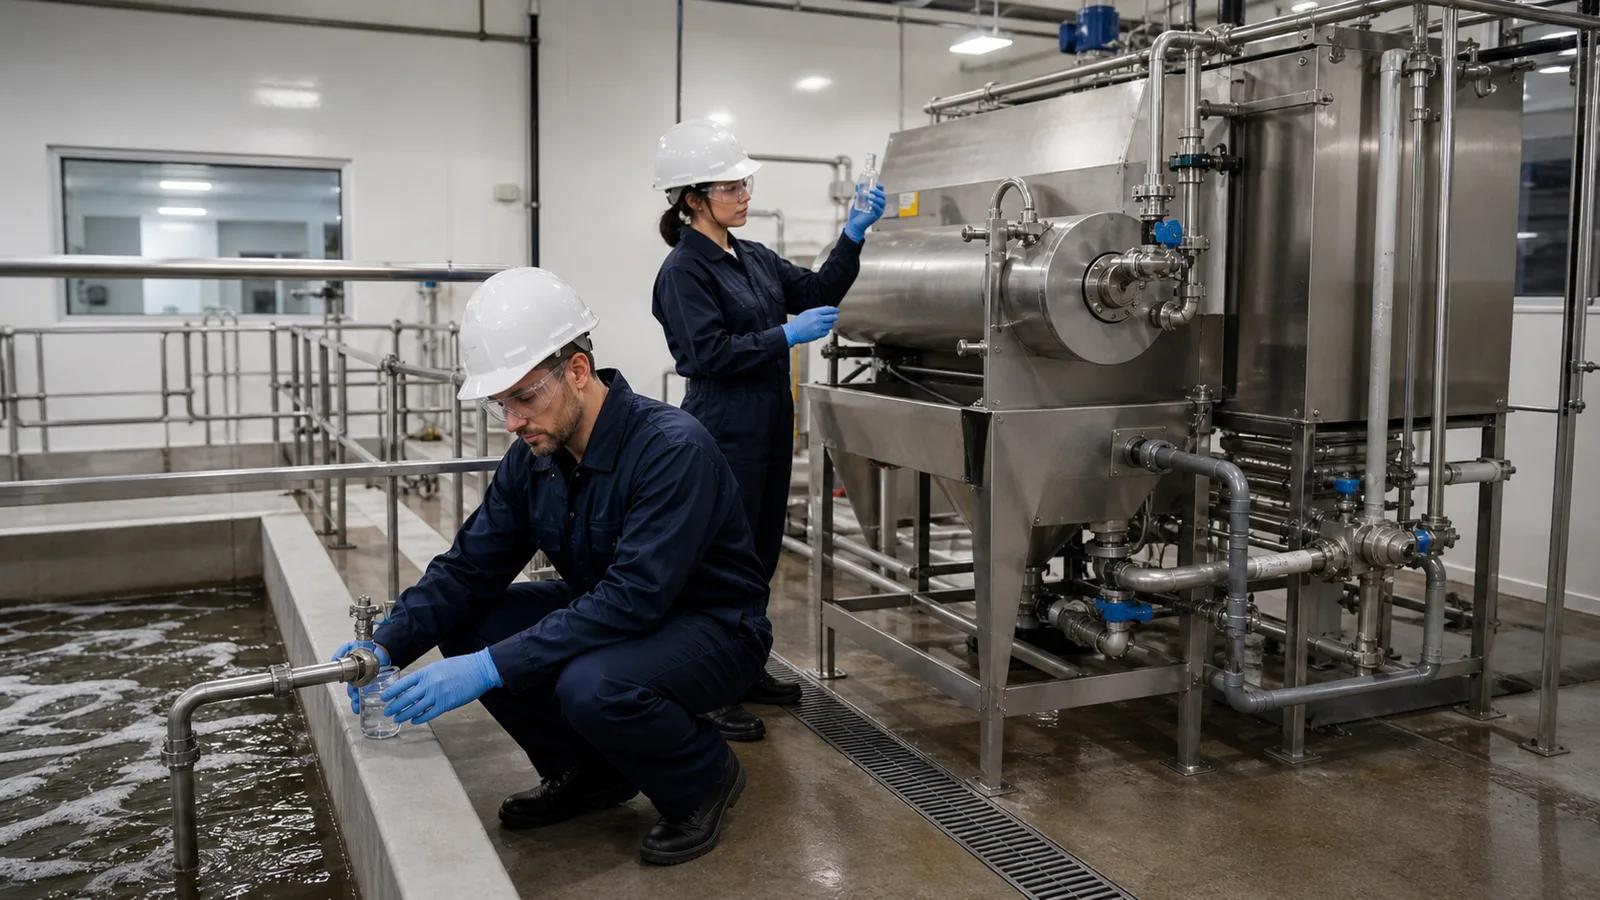
- Execute the sampling plan. Composite, grab and event samples with approved methods.
- Calculate mass and variability. Average, maximum day/hour and slug conditions.
- Reduce load at source. Product recovery, dry pickup, segregation and process control.
- Develop and verify treatment. Bench/pilot work where uncertainty is material.
- Freeze monitoring and response. Limits, alarms, diversion, reporting and records.
- Commission across representative production. More than one easy product and one clean day.
Commissioning and operating evidence
- Calibrated influent, internal-stream and effluent flow data.
- Production, product loss, sanitation and discharge events aligned by timestamp.
- Representative influent and effluent samples with laboratory quality-control records.
- Peak hydraulic performance through screens, pumps, tanks and control valves.
- pH, temperature, dissolved oxygen or other process-control trends as applicable.
- Chemical dose, sludge production and residuals disposal data.
- Alarm, emergency hold, overflow, standby and loss-of-power tests.
- Mass balance around major treatment stages.
- Permit reporting and corrective-action records.
Wastewater load planning FAQ
How is pollutant load calculated?
For mg/L and m3/day, kg/day equals concentration multiplied by flow and divided by 1,000. Both values must represent the same stream and period.
Is concentration enough to size treatment?
No. Design needs flow, mass load, peaks, variability, batch dumps, pH, temperature, treatability, nutrients, chemicals and required effluent.
Can total water use estimate wastewater flow?
It supports early screening with a documented percentage. Final work needs a stream-by-stream balance covering product water, evaporation, reuse, cooling, sanitary and process discharges.
Does the estimator determine legal compliance?
No. Compliance depends on discharge route, permit, category, local limits, methods and averaging periods.
Can lower water use increase wastewater concentration?
Yes. If pollutant mass stays constant while water falls, mg/L rises. Track both water intensity and pollutant kg per unit of accepted production.
Primary references
- U.S. EPA, Industrial Effluent Guidelines, current category and regulation portal.
- U.S. EPA, National Pretreatment Program.
- U.S. EPA, Pretreatment Roles and Responsibilities for Industrial Users.
- Electronic Code of Federal Regulations, 40 CFR Part 136, Guidelines Establishing Test Procedures.
- Codex Alimentarius, General Principles of Food Hygiene, CXC 1-1969.
Research reviewed: August 7, 2026. Planned review: August 7, 2027, or earlier if discharge requirements, production or wastewater characterization changes.