
Direct answer: measure actual flow and water-on time for every cleaning stage and multiply by the number of stations operating together. Keep event volume, daily volume and instantaneous peak separate. Add equipment dumps and CIP circuits independently. Any reduction or reuse must preserve the validated cleaning outcome and use water that is demonstrably fit for its next purpose.
Who uses this planning method?
Sanitation managers
Convert written cleaning procedures into water, temperature, chemical and timing requirements.
Factory and utility engineers
Size supply, hot-water generation, distribution, drainage and wastewater equalization.
Food-safety teams
Approve fit-for-purpose water, reuse barriers, monitoring and sanitation verification.
Operations and sustainability teams
Reduce waste through measurement and standard work without weakening hygiene controls.
The formulas used by the online estimator
Gross water/event (m3) = flow/station (L/min) x active water time (min) x simultaneous stations / 1,000Gross daily water = gross water/event x cleaning events/dayNet daily water = gross daily water x (1 - verified recovery fraction)Net monthly water = net daily water x operating days/monthAnnualized net water = net monthly water x 12The calculation assumes the entered stations flow for the same active duration. It does not model staggered stages, varying nozzle flows, tank dumps, CIP circuits, process water or the difference between incoming water and wastewater.
Worked example: volume and peak are different
Three stations each flow 18 L/min for 45 minutes of actual water-on time. Clean once per day, 22 days/month, with no approved reuse.
- Instantaneous supply while all stations flow = 18 x 3 = 54 L/min.
- Gross water/event = 18 x 45 x 3 / 1,000 = 2.43 m3.
- Net daily water = 2.43 m3/day.
- Net monthly water = 2.43 x 22 = 53.5 m3/month.
- Annualized water = 53.5 x 12 = 642 m3/year.
The utility must sustain 54 L/min at required pressure and temperature; the storage and annual cost discussion uses the volume values.
Map the sanitation sequence before calculating
| Stage | Record | Water-planning implication |
|---|---|---|
| Preparation and dry pickup | Product removal, disassembly, dry collection and protection. | Effective dry removal can reduce water and wastewater solids. |
| Pre-rinse | Flow, temperature, pressure, duration and endpoint. | Often a major water and solids-loading stage. |
| Detergent application | Concentration, foam/gel flow, coverage, temperature and dwell. | Chemical solution may use water but should not be counted again as rinse. |
| Mechanical action | Scrubbing, impingement, circulation and water-on status. | Cleaning time is not automatically water-on time. |
| Intermediate/final rinse | Flow, time, endpoint and required water quality. | Final rinse can control hygienic and chemical-residue acceptance. |
| Sanitizing and release | Agent, concentration, contact time, rinse/no-rinse status and verification. | Use and discharge depend on the validated chemistry and procedure. |
Measure active water time
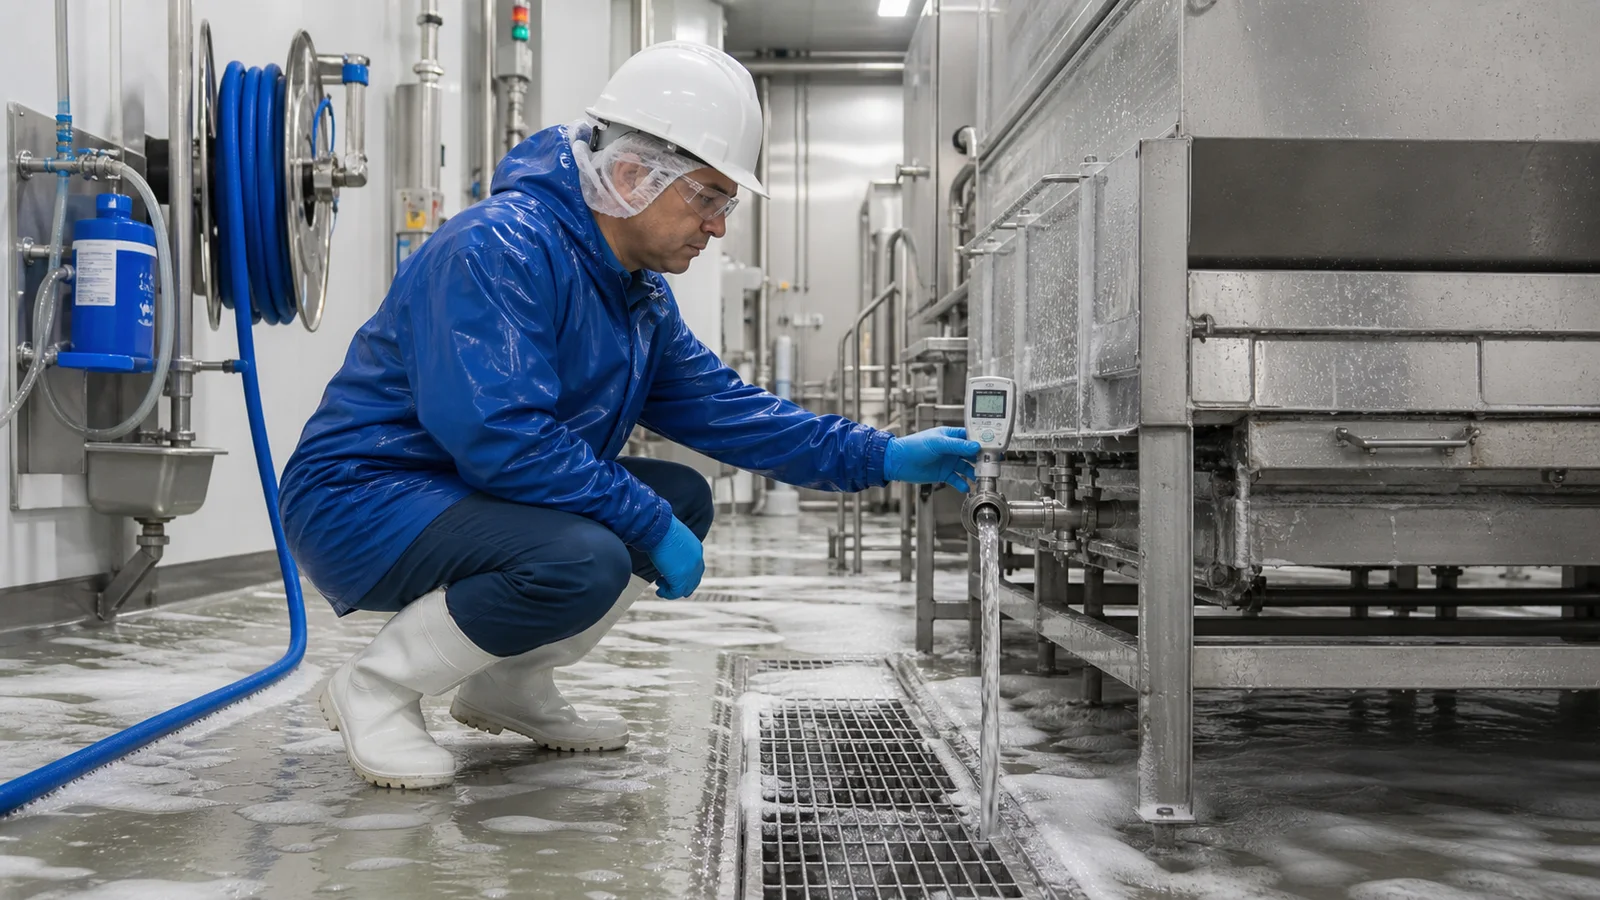
A 90-minute sanitation job may contain only 35 minutes of water flow. Estimate from the standard operating procedure for design, then verify with hose timers, flow totalizers or submeters. Record flow by stage because pre-rinse, foam application and final rinse may use different devices.
EPA's Lean & Water Toolkit recommends water balances, source meters and process submeters to identify water use and waste. Track at least event volume, active water time, accepted production, cleaning result and abnormal cause.
Peak flow and pressure at the station
Build a time chart showing which stations, COP tanks, CIP circuits and equipment fills operate together. Prove minimum pressure and temperature at the most remote point while the design combination runs. Include backflow protection, pressure-reducing devices, mixing stations, hoses and nozzles.
Hot-water energy and storage
Separate cold, warm and hot-water stages. A preliminary sensible-heating balance is:
Thermal energy (kWh) = water volume (L) x 4.186 kJ/kg.K x temperature rise (K) / 3,600Average heating power (kW) = thermal energy / available recovery or heating time (h)Add distribution and storage losses separately. Generator capacity may be controlled by simultaneous instantaneous flow, while tank volume depends on draw profile, incoming temperature, recovery rate and allowable delivery-temperature band. Check scalding, mixing-valve and microbial-control requirements under local rules.
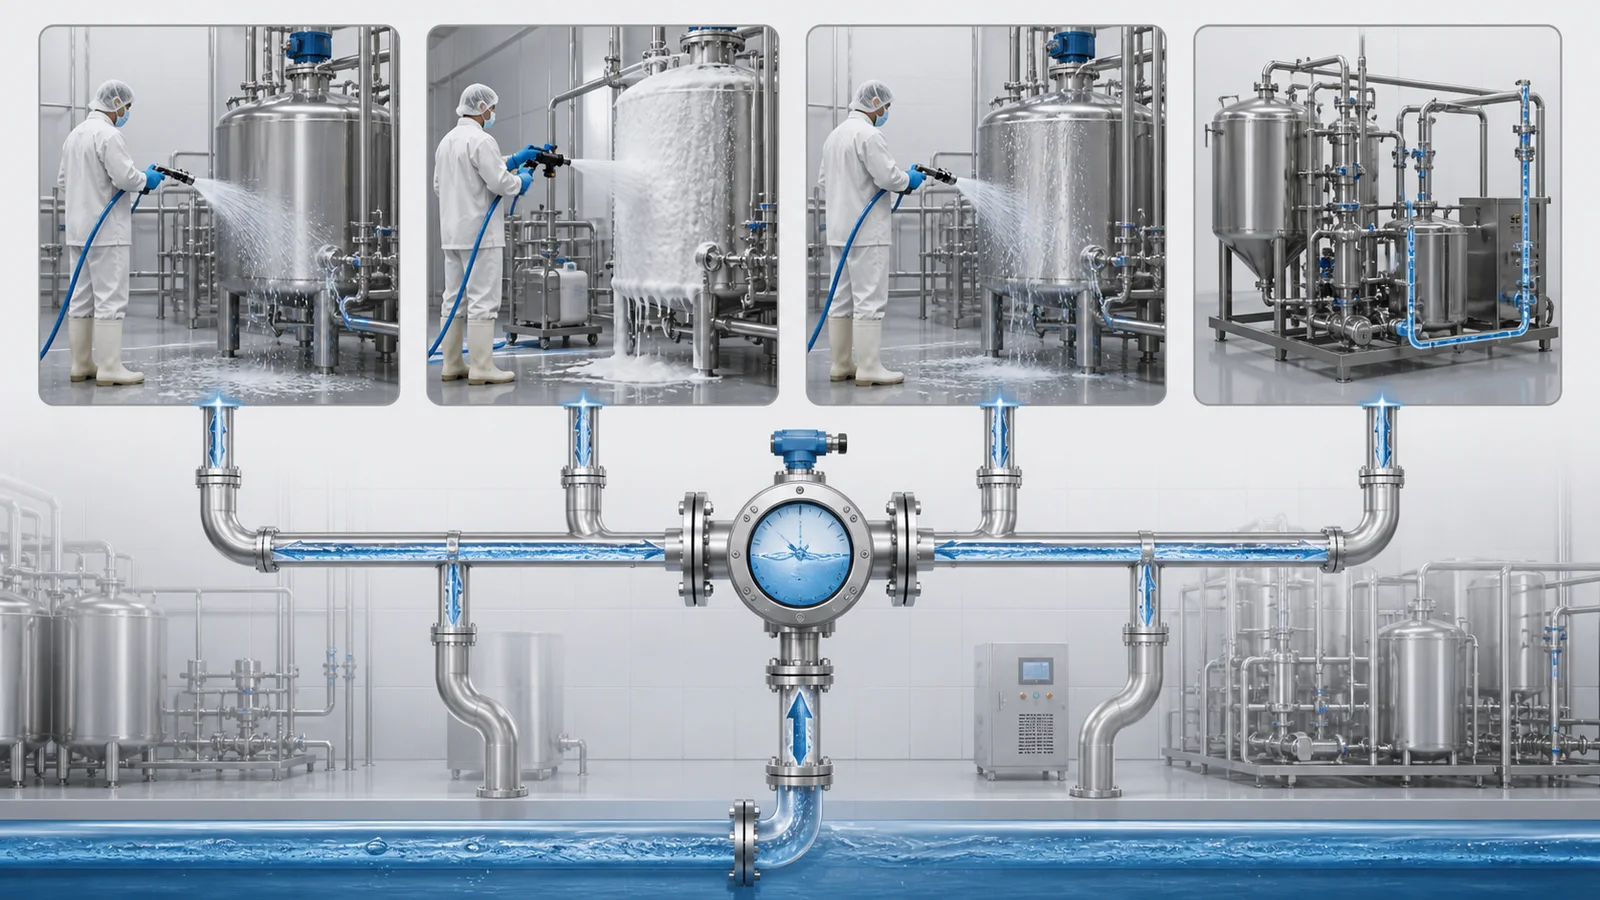
Water quality must be fit for purpose
Codex CXC 1-1969 requires adequate facilities and safe water management to prevent food contamination. FDA 21 CFR 117.37 requires an adequate water supply derived from a suitable source for intended operations in covered U.S. facilities. The required quality depends on source, product contact, cleaning stage, chemical system and market.
- Define microbiological, chemical and physical quality at the point of use.
- Include hardness, alkalinity, iron, chlorides or other parameters that affect chemicals, scale or equipment.
- Protect potable and treated systems from cross-connections and backflow.
- Set sampling locations, frequency, methods, alert/action limits and response.
- Control storage tanks, dead legs, temperature and low-use outlets.
Water reuse requires a complete risk case
The joint FAO/WHO report on water used in food production recognizes that water may be reused where it does not create a consumer health risk and promotes a fit-for-purpose approach. That is not permission to enter an arbitrary recovery percentage.
| Reuse decision field | Question to answer |
|---|---|
| Source | Which exact rinse, condensate or process stream, and under what worst conditions? |
| Next use | Will it contact food, a food-contact surface, packaging, floor or utility system? |
| Hazards | Microbiological, allergen, chemical, foreign-material and cross-product risks? |
| Treatment | Filtration, disinfection or other barriers, including failure monitoring? |
| Storage/distribution | Time, temperature, tank hygiene, dedicated pipe and backflow prevention? |
| Verification | Sampling, limits, release, diversion and corrective action? |
| Regulatory/customer approval | Which applicable authority and customer requirements govern the use? |
Keep gross water, recovered-water flow and fresh makeup visible. Reuse may reduce fresh intake without reducing wastewater if the recovered stream is later discharged.
CIP and COP need circuit-specific balances
For clean-in-place systems, list each tank and circuit volume, line fill, pre-rinse, detergent circulation, intermediate rinse, final rinse, recovery, pushout and drain. Include supply and return flow, velocity basis, temperature, concentration, cycle duration and number of circuits that may operate together.
For clean-out-of-place tanks, include fills, overflow, part displacement, rinse changes and complete dumps. Do not force a tank-based cycle into the hose-station estimator.
Link cleaning water to drainage and wastewater
Incoming flow is not automatically the drain peak. Hoses can flow continuously while equipment tanks discharge as short batches. Build a discharge timeline containing:
- Hose and station runoff by area.
- CIP and COP tank dumps and return timing.
- Cooker, blancher and cooling-system drains.
- Product solids, fats, oils, grease and screening load.
- Temperature, pH and cleaning/sanitizing chemicals.
- Floor travel time, channel capacity, sumps and pump cycles.
- Equalization, pretreatment and permitted discharge limits.
Water-efficiency hierarchy
- Prevent soil and product loss at source.
- Use dry pickup before applying water where hygienically suitable.
- Repair leaks and automatic shutoff failures.
- Standardize nozzles, pressure, flow and water-on time.
- Use visible rinse endpoints or validated controls instead of unbounded time.
- Sequence stations to control peaks without extending unsafe sanitation windows.
- Optimize CIP recovery and push methods through validated trials.
- Evaluate fit-for-purpose reuse with food-safety and regulatory approval.
Verify hygiene after each change. A lower water KPI with increased re-cleaning, chemical residue, microbiological failure or product risk is not an improvement.
Ten-step project workflow
- List all cleaning systems. Manual, foam, COP, CIP, vehicle, crate and facility cleaning.
- Map each validated cycle. Water-on stages, flow, temperature and duration.
- Measure actual outlets. Avoid relying only on nominal nozzle ratings.
- Calculate event volumes. Keep gross, recovered and fresh makeup separate.
- Build simultaneous-flow scenarios. Prove pressure and hot-water delivery.
- Calculate thermal demand. Inlet temperature, delivery temperature, profile and losses.
- Develop discharge profiles. Continuous runoff and batch dumps.
- Assess water quality and reuse. Fit-for-purpose limits, barriers and monitoring.
- Commission utility interfaces. Flow, pressure, temperature, metering and drainage.
- Benchmark and control. Water per event and accepted production with hygiene results.
Commissioning evidence
- Calibrated station flow and pressure with the design number operating.
- Delivery temperature and recovery through the full sanitation event.
- Actual water-on time and totalized volume by stage or system.
- Water-quality results at specified source and point-of-use locations.
- Chemical concentration, contact time and final-rinse acceptance data.
- Drainage performance during the controlling continuous and batch scenarios.
- Wastewater flow, temperature, pH and relevant load samples.
- Reuse barrier, diversion, alarm and cross-connection tests where applicable.
- Cleaning verification and validation results after efficiency changes.
Cleaning water planning FAQ
How do I calculate cleaning water use?
Multiply measured flow per active station by actual water-on time and simultaneous stations. Multiply by event frequency and operating days, then subtract only approved and verified reuse.
Is cleaning duration the same as active water time?
No. Dry pickup, detergent dwell, scrubbing, disassembly and inspection can occur with water off. Measure actual flowing time.
Can final-rinse water always be reused?
No. Complete a fit-for-purpose risk assessment for source, next use, treatment, storage, monitoring, cross-connections and applicable requirements.
Does daily water volume size the drain?
No. Drainage requires instantaneous hose flows, timed equipment dumps, solids, fats, temperature, chemicals, floor hydraulics and downstream capacity.
Should CIP water be entered as station flow?
No. Develop a circuit balance from tank, line, rinse, circulation, recovery and dump volumes and their timing.
Primary references
- Codex Alimentarius, General Principles of Food Hygiene, CXC 1-1969.
- Electronic Code of Federal Regulations, 21 CFR 117.37, Sanitary facilities and controls.
- U.S. EPA, Lean & Water Toolkit, current online version reviewed in 2026.
- FAO/WHO, Safety and quality of water used in food production and processing.
Research reviewed: August 7, 2026. Planned review: August 7, 2027, or earlier if hygiene requirements, reuse policy or the site water basis changes.