
Direct answer
A food-line bottleneck is the resource or operating rule that most limits accepted system throughput for the current product, schedule and conditions. Start with the lowest effective capacity, but confirm the constraint through utilization, persistent upstream accumulation, downstream starvation and a sensitivity test. A bottleneck can move after an improvement or when the product mix changes.
Use the correct time and rate terms
Net production time / customer demandThe maximum average time budget per accepted unit needed to meet demand. It is a planning target, not a measured machine cycle.
Observed process time / units completedThe time a station needs per unit or batch under defined conditions. Record variation, not only the best cycle.
Accepted output / observation timeThe realized flow of conforming product through the selected machine or line boundary.
Nominal rate x availability x performance x qualityA planning estimate after explicit losses. Keep units and time boundaries consistent across every station.
Record why equipment is not producing
NIST manufacturing research emphasizes that aggregated machine KPIs do not capture interactions between machines and material handling. Time-stamped states expose whether an idle machine is itself failing or is responding to another constraint.
Starvation ratio = starved time / planned production time
Blocking ratio = blocked time / planned production time
High starvation points upstream; high blocking points downstream. These are diagnostic signals, not proof by themselves.
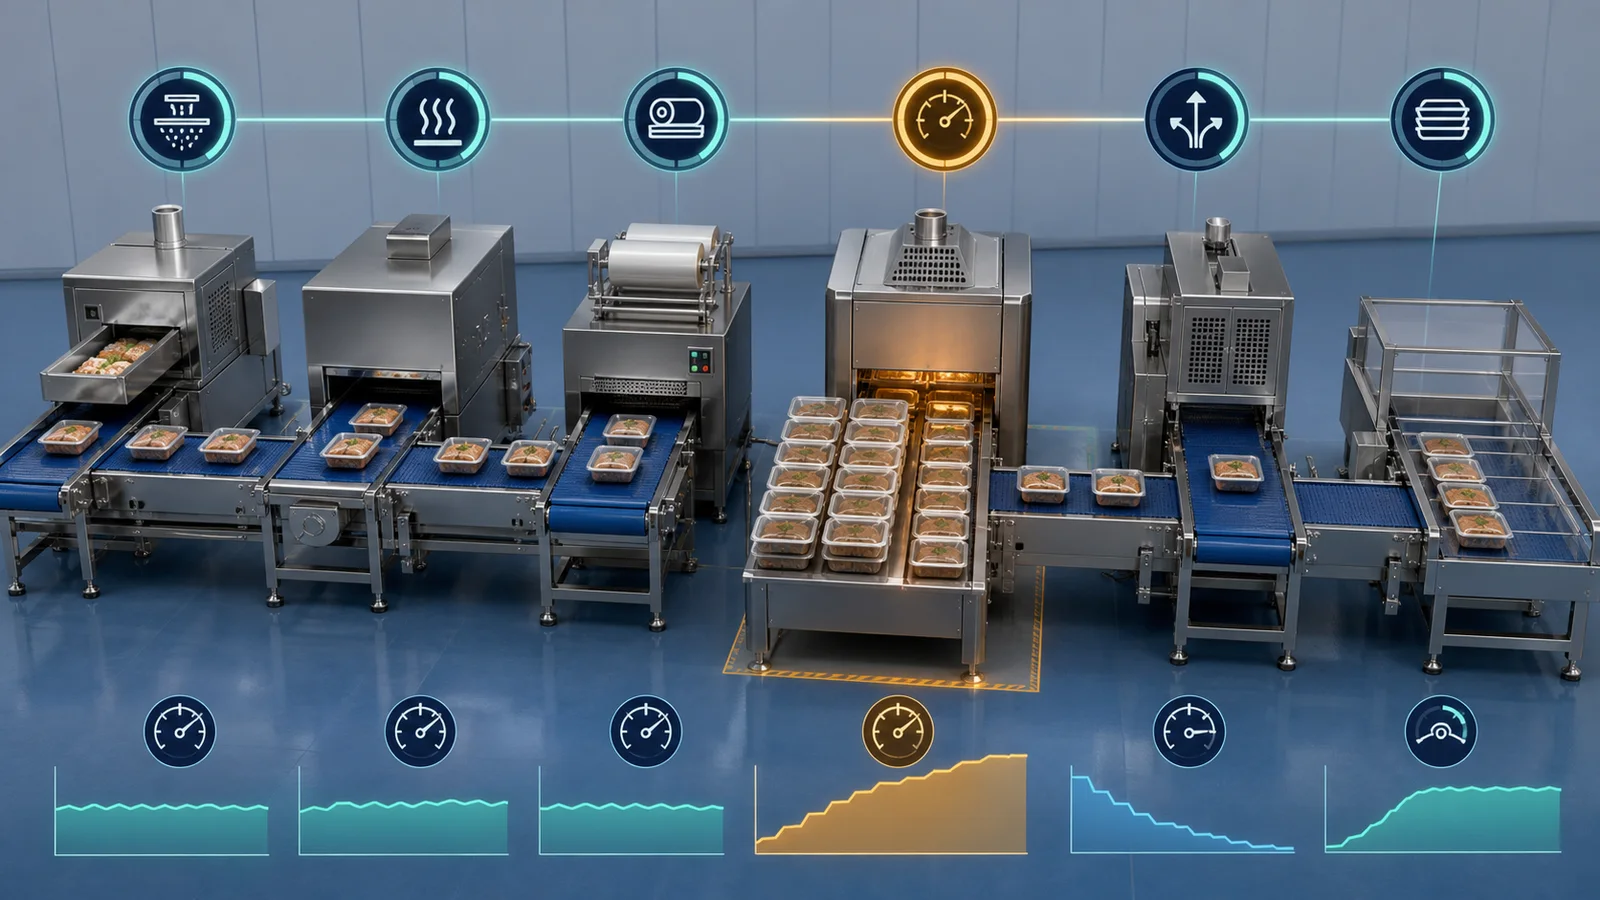
A seven-step bottleneck analysis
Build one comparable station worksheet
| Station | Accepted rate | Availability | Starved | Blocked | Changeover | Quality loss | Buffer after |
|---|---|---|---|---|---|---|---|
| Preparation | kg/h or pieces/min | % of planned time | min and cause | min and cause | min/SKU | % and defect | quantity + max hold |
| Core process | same product basis | same boundary | timestamped | timestamped | recipe/tooling | accepted criteria | temperature/state |
| Packaging | accepted packs/min | same boundary | from upstream | case/carton limit | film/format | seal/weight/reject | pack accumulation |
Use one observation window and one accepted-product basis. Converting upstream input kilograms and downstream packaged units without yield, product weight and pack count creates a false balance.
Worked example: a five-operation prepared-food line
Initial product-specific effective capacities
| Operation | Nominal rate | Combined effective factor | Effective capacity | Observed signal |
|---|---|---|---|---|
| Preparation | 1,000 kg/h | 95% | 950 kg/h | Regularly blocked |
| Mixing / batching | 900 kg/h average | 88% | 792 kg/h | Short batch gaps |
| Forming | 780 kg/h | 92% | 718 kg/h | Blocked before thermal step |
| Thermal process | 850 kg/h | 80% | 680 kg/h | High utilization; WIP upstream |
| Packaging | 760 kg/h | 93% | 707 kg/h | Starved by thermal batches |
The thermal process is the first constraint candidate because it has the lowest effective capacity, runs at high load and creates accumulation upstream while packaging is starved. The measured line rate is lower than 680 kg/h because batch release, transfer and short stops create additional interaction loss.
Buffers reduce interaction loss, but do not create capacity
What a buffer can do
Absorb short-cycle variation, allow a batch discharge to feed a continuous machine and reduce immediate starvation or blockage during a brief stop.
What a buffer cannot do
Compensate indefinitely for a slower downstream process, repair poor quality, remove a chronic changeover loss or increase the processing rate of the constraint.
Buffer time = usable buffer quantity / downstream consumption rateUsable quantity may be lower than physical volume. Reserve operating limits and account for product geometry, bulk density, minimum drawdown and safe handling.
For food, buffer design must also define maximum hold time, product temperature, agitation or deformation risk, contamination control, allergen identity, lot traceability, first-in-first-out behavior and the cleaning method. An oversized buffer can increase food-safety and quality risk while hiding the real constraint.
Prioritize improvements at the active constraint
When a spreadsheet is no longer enough
Use discrete-event simulation when the line has interacting batch and continuous processes, parallel machines, random failures, several products, shared operators, finite buffers or complex routing. NIST identifies simulation as a way to find constraints, test product-mix and schedule changes, estimate resources and validate expected facility performance. A model must first reproduce the measured current state; an unvalidated model only automates assumptions.
Food line balancing FAQ
What is the bottleneck in a food production line?
It is the resource or rule that most limits accepted system throughput for the current product mix and operating conditions. It may move after an improvement or schedule change.
Is the slowest machine always the bottleneck?
No. Lowest effective capacity is an initial candidate. Downtime, batch timing, quality loss, starvation, blockage, shared labor and product mix can make another resource the active constraint.
Does takt time equal machine cycle time?
No. Takt time is the production-time budget per unit required to meet demand. Cycle time is the observed time a process needs per unit or batch. A station must normally sustain a cycle time at or below takt, with losses and variability considered.
Can a buffer increase production capacity?
A buffer cannot create processing capacity. It can reduce interaction loss by temporarily decoupling variation, but it must comply with holding-time, temperature, hygiene, quality and traceability limits.
How long should data be collected?
Use enough representative runs to include normal products, shifts, changeovers, minor stops, failures and sanitation. One unusually stable hour is not evidence of sustainable line performance.
Research basis and further reading
- ISO 22400-1:2014, Manufacturing operations management KPI framework - provides industry-neutral concepts and terminology for defining and using manufacturing KPIs; ISO confirmed the edition in 2025.
- NIST-authored research, A Hierarchical Structure of KPIs for Production Systems - defines blocking, starvation, WIP, buffer capacity and related ratios needed to understand machine interactions.
- NIST, Benchmarking Production System and Process Energy Performance - describes off, busy, idle, down, starved and blocked equipment states and production-system model data.
- NIST, Multi-Job Production Systems - shows that throughput and bottlenecks can depend on product mix in serial lines.
- NIST MEP food-processing line case - reports use of takt time and line balancing to address a tray-packing bottleneck.
- NIST MEP, Simulation Is a Window Into the Future - describes simulation uses for bottlenecks, throughput, product mix, buffers and resource planning.
Scope note: This guide is an engineering planning framework. It does not guarantee line output or replace time studies, food-safety assessment, validated process limits, supplier trials or a qualified simulation study.
Map the constraint with your own station data
Start with the Bottleneck Calculator, then calculate the accepted rate the line must sustain. Use matching units, products and observation periods.
Open Bottleneck CalculatorOpen Line Speed Calculator