
Direct answer
Build the water balance from individual uses and discharge events, not from a single monthly average. For cleaning, multiply measured station flow by active water time, simultaneous stations and events. For wastewater, map each stream and calculate both flow and pollutant mass load. Daily volume supports resource planning; instantaneous dumps and concentration variation determine drainage, equalization, sampling and treatment requirements.
gross cleaning water/event = L/min x active minutes x simultaneous stations / 1000pollutant load kg/day = concentration mg/L x flow m3/day / 1000Separate active water time from sanitation duration
A two-hour sanitation shift does not mean every hose runs for two hours. Record pre-clean dry collection, pre-rinse, foaming, contact time, manual action, intermediate rinse, disinfection, final rinse where required and drying as distinct steps. Only steps with water flowing belong in active water time.
Open-plant cleaning
Measure nozzle flow at operating pressure, number of simultaneously active stations, active minutes and frequency by zone.
CIP circuits
Balance tank fills, displacement, rinses, recovered solutions, final rinse, dumps and overlapping circuits separately.
Equipment dumps
Washers, cookers, coolers, flumes and tanks can release large volumes over minutes rather than evenly over a day.
Non-cleaning water
Keep ingredient, cooling, boiler, domestic, irrigation, fire and other uses separate so discharge destinations remain traceable.
Three stations, two cleaning events per day
Assume each station delivers 18 L/min, active water time is 45 minutes per event, and three stations operate simultaneously.
water/event = 18 x 45 x 3 / 1000 = 2.43 m3gross daily cleaning water = 2.43 x 2 events = 4.86 m3/daynet new water with validated 10% recovery = 4.86 x 0.90 = 4.374 m3/dayThe 10% recovery is an illustration, not permission to reuse water. The intended reuse must be fit for purpose under the food-safety system.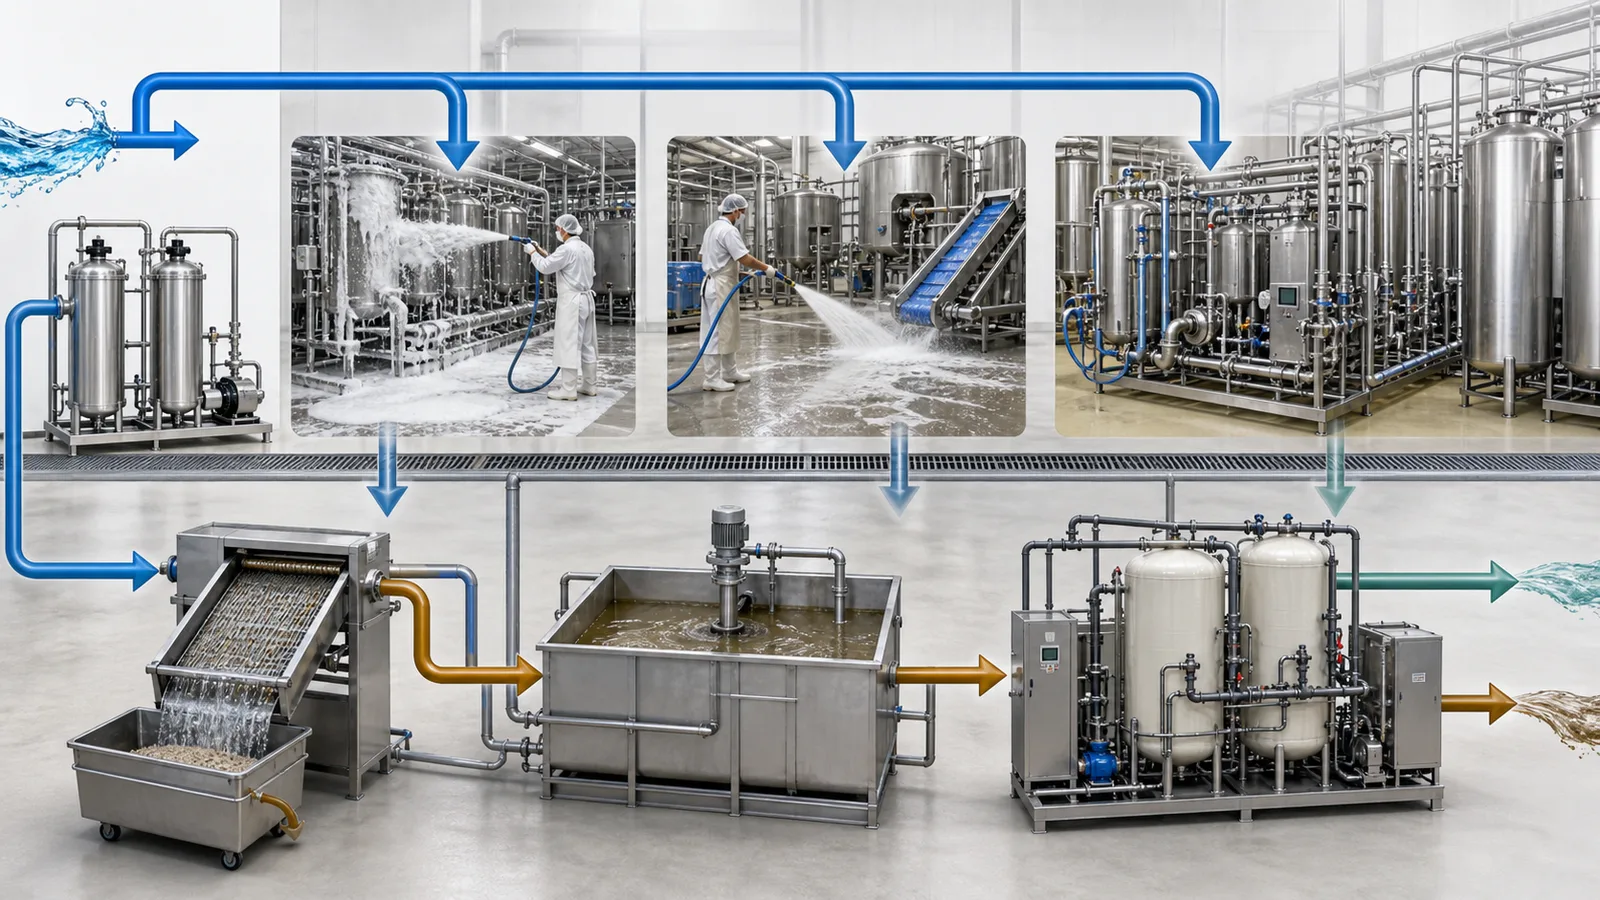
Segregate streams before they become one problem
High-solids or high-fat stream
Product residues, blood, dough, starch, fat and concentrated first rinses may justify source capture or dedicated pretreatment.
Hot or chemical stream
CIP dumps, caustic, acid, sanitizer and hot water can create pH, temperature and compatibility peaks.
Lower-strength water
Some cooling, condensate or final-rinse streams may have different reuse or discharge potential after documented assessment.
Sanitary and storm water
Keep domestic sewage and uncontaminated stormwater distinct from process wastewater as required by the site and jurisdiction.
Convert concentration into daily mass load
Assume total factory water use is 120 m3/day and 85% is discharged as wastewater. Representative data for the mapped combined stream are COD 2,200 mg/L, BOD 1,100 mg/L, TSS 650 mg/L and FOG 300 mg/L.
| Parameter | Concentration | Wastewater flow | Mass load |
|---|---|---|---|
| COD | 2,200 mg/L | 102 m3/day | 224.4 kg/day |
| BOD | 1,100 mg/L | 102 m3/day | 112.2 kg/day |
| TSS | 650 mg/L | 102 m3/day | 66.3 kg/day |
| Fats, oils and grease | 300 mg/L | 102 m3/day | 30.6 kg/day |
| Hydraulic basis | 120 x 0.85 | 102 m3/day | |
Concentration alone cannot show treatment size. A lower concentration at a much higher flow may carry the same or a greater daily mass load.
Daily flow cannot size a drain or equalization tank
Three 18 L/min hoses create 54 L/min while all are open. A 10 m3 process tank emptied in 15 minutes creates an average dump rate of about 667 L/min before other flows are added. Map the start time and duration of every dump, CIP return and sanitation event to build an hourly or shorter-interval hydrograph.
event discharge L/min = event volume m3 x 1000 / discharge minutes10 m3 x 1000 / 15 min = 666.7 L/minGravity drainage, pumps, screens, fat separation and equalization must be assessed against coincident event peaks and solids behavior.Match the sample method to the question
Flow-proportional composite
Useful for variable streams and average mass loading because aliquots reflect discharged volume.
Time-proportional composite
Can represent average conditions when flow is sufficiently understood, but may bias a strongly variable stream.
Grab sample
Useful for a specific event or parameters that require immediate capture, including some pH, temperature, oil and grease or volatile measurements.
Production context
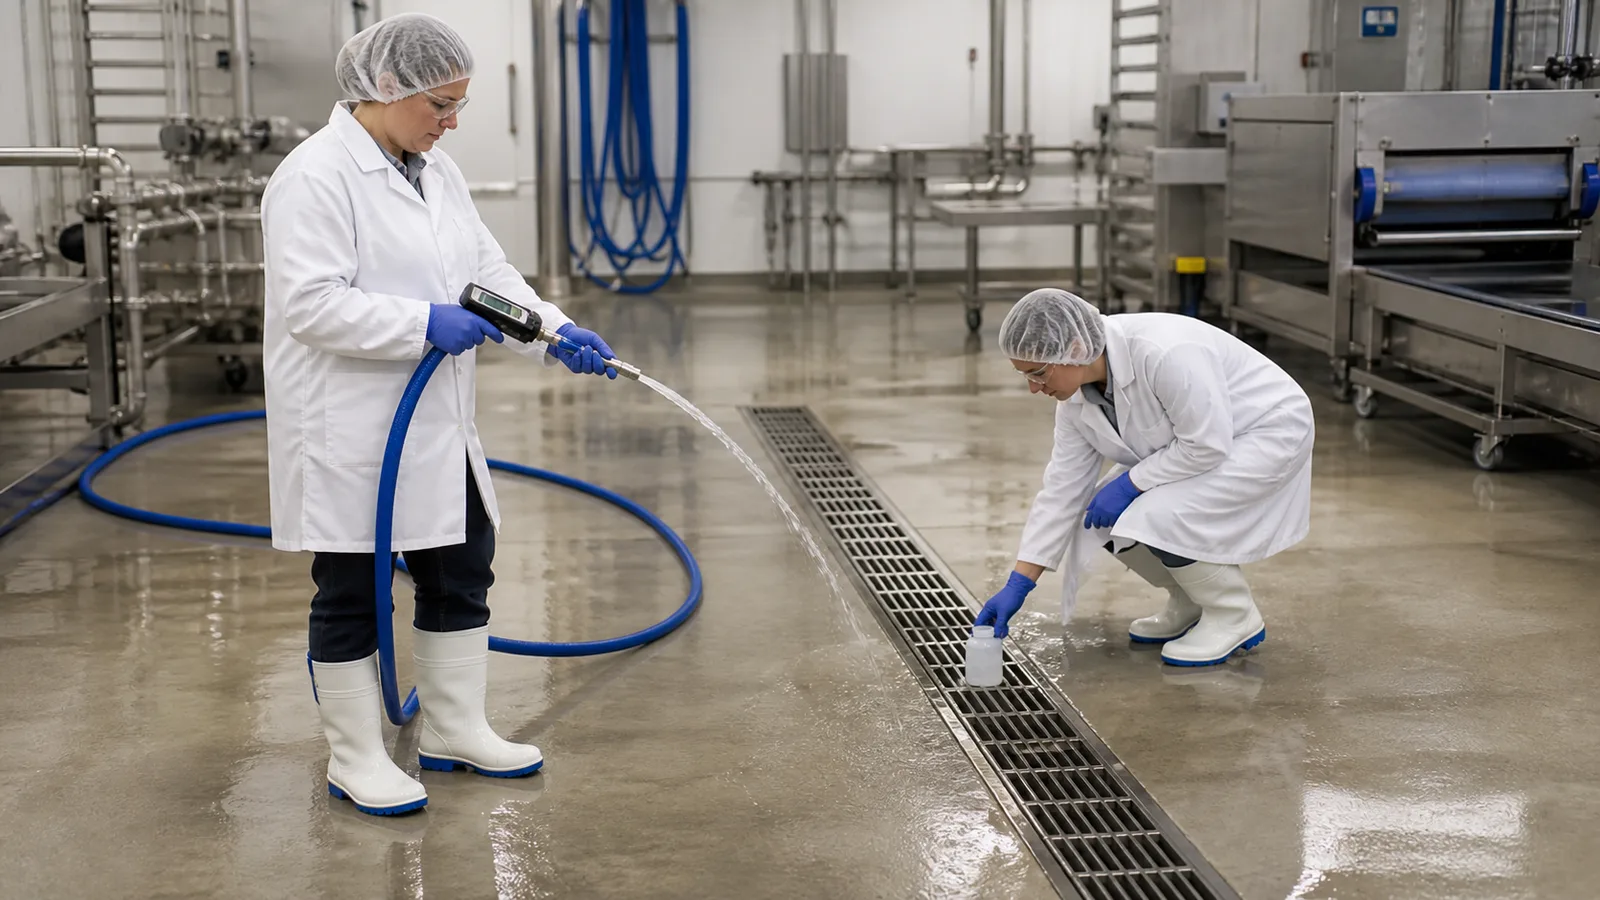
Record product, shift, cleaning event, flow, sample point, time, preservation, method and laboratory chain of custody.
EPA guidance notes that composite samples are used when average concentration or mass-per-time loading is needed, while grab samples help characterize fluctuations, extremes and certain parameter-specific requirements.
A recovery percentage is not a food-safety decision
Codex CXG 100-2023 uses a risk-based, fit-for-purpose approach. Assessment should consider source water, intended use, product exposure, downstream controls, treatment capability, storage, distribution, monitoring and corrective action. Water suitable for a non-food-contact task is not automatically suitable for product contact, final rinse or ingredient use.
Build one water and wastewater design basis
Identify source, required quality, flow, duration, frequency and operating schedule.
Verify hose, nozzle, CIP, washer, tank and process flows rather than relying only on nameplates.
Recover product and remove gross residues by an approved dry method where suitable.
Record destination, volume, duration, temperature, pH and contamination type.
Overlay production, dump, cleaning and CIP events to identify coincidence.
Select sample points, flow measurement, composite or grab methods and operating cases.
Combine flow and concentration for COD, BOD, TSS, FOG, nutrients and site-specific parameters.
Compare source recovery, screens, equalization, FOG removal, pH control and biological or other treatment.
Qualified specialists reconcile discharge limits, sewer agreements, water reuse and the food-safety plan.
Data the calculator does not supply
There is no universal food-factory discharge limit
Requirements depend on country, receiving route, industry category, production scale and permit. In the United States, for example, EPA's 40 CFR Part 432 applies to specified direct dischargers in meat and poultry processing, while discharges to publicly owned treatment works operate under different pretreatment and local requirements. Do not copy a limit from another factory or discharge route.
Food hygiene also takes priority over unvalidated water reduction. Cleaning and disinfection must remain effective, water must be suitable for its use, drainage must not create contamination, and recovered water requires controlled risk assessment.
Cleaning water and wastewater FAQ
Is total sanitation time the same as active water time?
No. Active water time includes only periods when water flows. Foaming, contact, scrubbing and inspection may consume time without consuming water.
Can total water use be multiplied by one discharge percentage?
Only as an early screening estimate. A real balance should identify product water, evaporation, condensate, retained moisture, reuse, domestic use and each discharge route.
Is COD concentration enough to size treatment?
No. Treatment design needs hydraulic and mass loads, peaks, biodegradability, solids, FOG, pH, temperature, nutrients, chemicals and variability.
Can recovered final rinse automatically become first rinse?
No. The source, treatment, storage, distribution and intended use require a fit-for-purpose hazard assessment and validated controls.
Should high-strength streams be mixed immediately?
Not automatically. Separate collection may improve product recovery and reduce treatment cost, but the best route depends on quantity, composition, hygiene and local disposal options.
Calculate both sides of the water balance
Estimate cleaning demand by event, then convert representative wastewater data into daily flow and pollutant loads.
Cleaning Water EstimatorWastewater Load EstimatorSources and technical references
- Codex CXG 100-2023, revised 2024 - risk-based, fit-for-purpose use and reuse of water in food production and processing.
- Codex CXC 1-1969 - water, drainage, cleaning, monitoring and food-hygiene controls.
- US EPA Meat and Poultry Products Effluent Guidelines - current scope and status of 40 CFR Part 432 for covered direct dischargers.
- US EPA National Pretreatment Program resources - pretreatment and fats, oils and grease control references.
- EPA Industrial User Inspection and Sampling Manual - grab and composite sampling principles for variable industrial wastewater.
- 21 CFR 117.37 - U.S. requirements for water supply, plumbing and sewage disposal in covered food plants.