
Who should use this guide?
Maintenance managers
Rank recurring failure modes by production consequence as well as repair frequency.
Production planners
Evaluate buffers, recovery shifts and the effect of a stop on customer orders.
Factory and finance teams
Build a shared basis for spare parts, redundancy and reliability investment decisions.
The calculator's screening formula
Use one currency and accepted output units. The production rate must represent output genuinely prevented by the interruption, not merely the stopped machine's nameplate speed.
Worked example: a recurring three-hour interruption
| Input | Value | Basis |
|---|---|---|
| Downtime per incident | 3 h | From stop until stable accepted output |
| Accepted production rate | 500 kg/h | Normal accepted line output |
| Gross contribution | 1.20/kg | Selling value less avoided variable cost |
| Idle labor | 6 workers at 12/h | Loaded direct labor that cannot be reassigned |
| Scrap and recovery | 350/incident | Product disposal, cleanup and restart allowance |
| Frequency | 2 incidents/month | Controlled trailing incident record |
Idle labor = 3 × 6 × 12 = 216
Incident cost = 1,800 + 216 + 350 = 2,366
Monthly impact = 2,366 × 2 = 4,732
Annualized impact = 4,732 × 12 = 56,784
The result is a screening estimate in the input currency. It becomes overstated if the line had sufficient buffer or all production was recovered without losing contribution. It becomes understated if restart, cold-chain, customer or downstream effects exceed the 350 allowance.
Determine whether the machine is a constraint
A stopped machine can be important without immediately reducing finished output. First test the line response:
Direct constraint stop
The bottleneck stops, downstream buffer empties and accepted output falls for the full interruption.
Protected by buffer
Line output continues until the buffer is consumed. Cost only the unprotected period and later replenishment effect.
Parallel capacity
Other machines continue at reduced aggregate rate. Use the net line-output difference.
Excess capacity
The machine recovers before starving the constraint. Lost contribution may be zero although repair and labor costs remain.
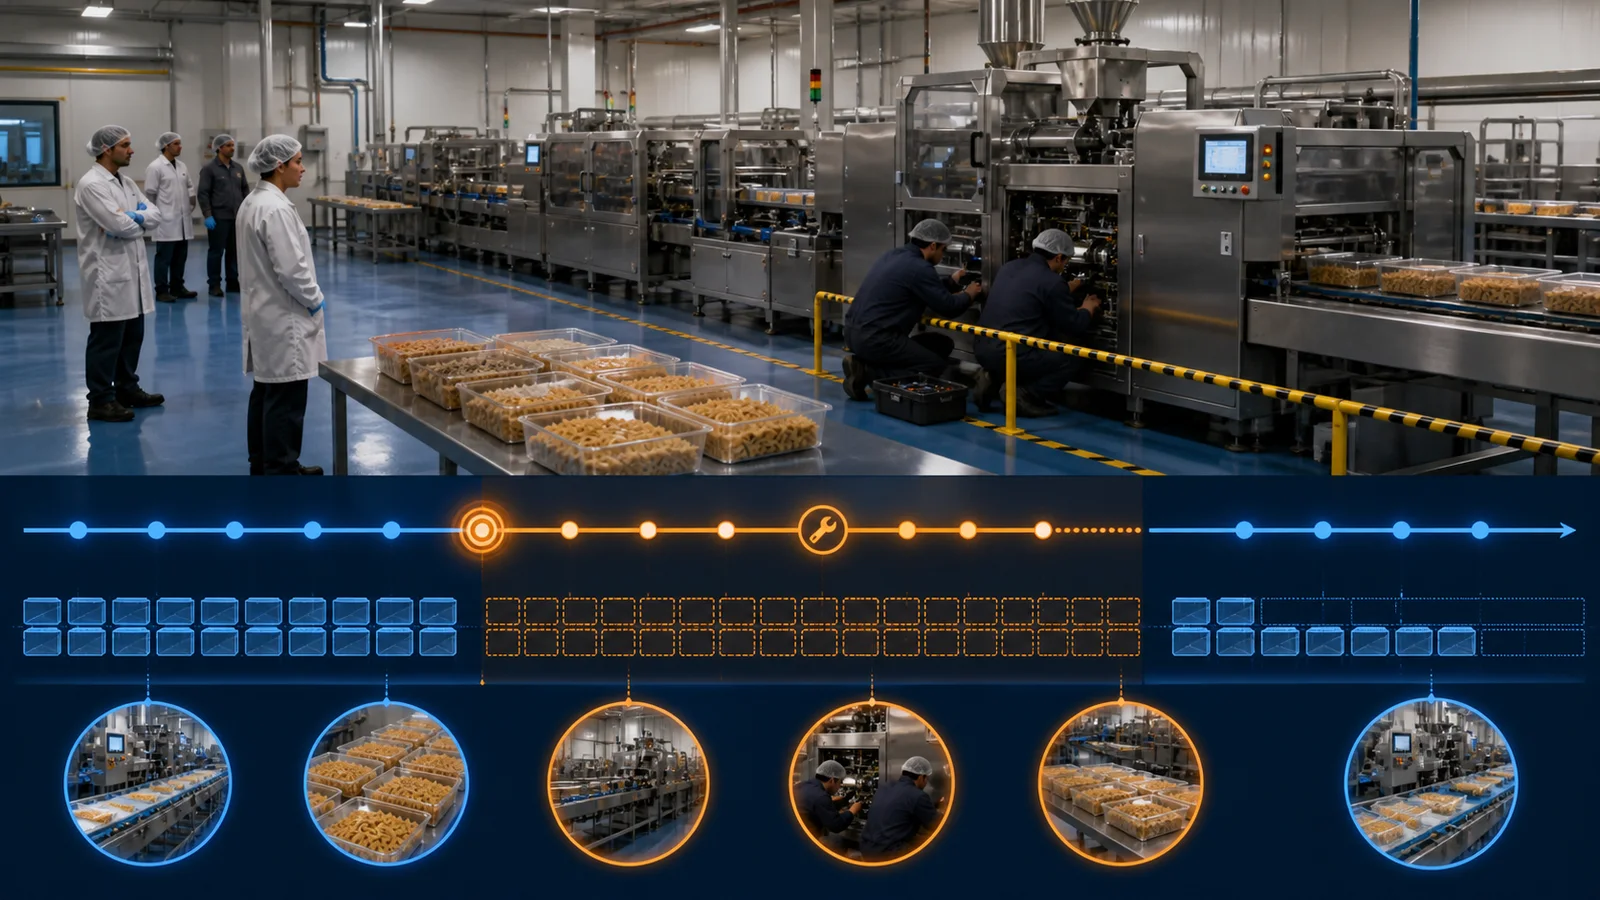
Use contribution, not total revenue
Total sales revenue includes costs that may not be incurred when production does not occur. Use a finance-approved contribution basis that subtracts avoidable materials, packaging, commissions and other truly variable costs. Do not subtract fixed labor or depreciation automatically if those costs continue during the stop.
Measure the full interruption window
Repair time alone is not the whole production loss. Record detection, safe shutdown, diagnosis, part retrieval, repair, reassembly, sanitation, inspection, quality release, warm-up, ramp-up and stable accepted production. In food plants, a short mechanical repair can require a longer controlled restart.
| Cost layer | Examples | Evidence |
|---|---|---|
| Immediate production | Unrecovered accepted output and contribution | Constraint rate, buffer trend, order recovery plan |
| Labor | Idle, maintenance, sanitation, overtime and contractor hours | Time records and loaded rates |
| Product and material | WIP loss, packaging, ingredients, rework and disposal | Mass balance and disposition records |
| Restart and utilities | Heating, cooling, steam, water, cleaning chemicals and validation | Meter, cycle or engineering estimate |
| Delivery and customer | Expedited freight, penalties, late orders and lost business | Order and commercial records |
| Upstream and downstream | Blocked raw material, cold storage, starving lines and rescheduling | Plant schedule and inventory movement |
If production is recovered later
Do not claim the full original contribution loss when the same saleable quantity is produced later. Instead, value the recovery:
- Overtime and premium labor.
- Additional startup, sanitation or allergen changeover.
- Extra utilities, waste and unstable startup output.
- Displaced production from another product or customer.
- Expedited freight and schedule penalties.
- Capacity risk created by using all remaining recovery time.
Recovery is not free merely because the shipment was eventually completed.
Frequency, duration and criticality must remain separate
A frequent two-minute jam and a rare eight-hour drive failure require different controls. Record event frequency, mean duration, maximum credible consequence and detectability. Expected annual cost is useful for recurring events, but rare food-safety, worker-safety or major customer risks need risk assessment beyond an average monetary value.
Prioritize reliability actions
- Define the line and constraint. Identify where accepted output is actually limited.
- Code stop events consistently. Capture start, stable restart, equipment, mode and reason.
- Validate lost output. Account for buffers, parallel equipment and later recovery.
- Build the incident cost. Separate contribution, labor, scrap, restart and external costs.
- Rank repeatable failure modes. Use annual impact, safety, quality and customer consequence.
- Confirm root cause. Do not replace parts repeatedly without evidence.
- Compare interventions. Evaluate prevention, condition monitoring, spares, redesign, redundancy and training.
- Verify sustained reduction. Compare event frequency, duration, output and cost after implementation.

Safety and hygiene are not cost variables
Never shorten energy isolation, guarding, sanitation or quality release to improve downtime metrics. OSHA's U.S. lockout/tagout requirements address unexpected energization and stored energy during servicing; equivalent local requirements must be followed. The stop clock does not override safe work authorization.
Minimum downtime event record
Asset and line; SKU and order; event start; safe access time; diagnosis; repair completion; sanitation and quality release; stable accepted-output time; stop code; failure mode; parts and labor; WIP and scrap; buffer and constraint status; output recovered later; customer impact; root cause; corrective action; owner and verification date.
Frequently asked questions
How is food production downtime cost calculated?
Add unrecovered lost contribution, idle labor, scrap, restart and incident-specific costs for the actual line effect, then apply a controlled frequency.
Should downtime cost use sales revenue?
Usually no. Use a finance-approved contribution after excluding variable costs that were avoided.
What if production is recovered later?
Reduce lost contribution and include overtime, utilities, extra changeovers, displaced production and delivery costs created by recovery.
Does every stopped machine stop line output?
No. Buffers, parallel equipment and excess capacity can protect the constraint temporarily or completely.
Can annualized downtime cost approve an investment?
It supports comparison, but investment approval also requires failure probability, implementation cost, residual risk, useful life and verified benefits.
Estimate one recurring interruption
Use accepted line output and contribution, then adjust the result for constraint position, buffers and recovered production.
Open the Production Downtime Cost Calculator | Read the food-production OEE guide
Standards and primary references
- NIST AMS 100-18, The Costs and Benefits of Advanced Maintenance in Manufacturing (2018) - maintenance-cost categories and data requirements.
- NIST AMS 100-34, Economics of Manufacturing Machinery Maintenance (2020) - downtime, labor, energy, capital, defect and delay effects.
- ISO 22400-1:2014, Manufacturing operations management KPIs - KPI framework, terminology and controlled use; confirmed current by ISO in 2025.
- NIST, Reliability-Centered Maintenance and manufacturing operations research - unscheduled downtime and maintenance-resource context.
- OSHA 29 CFR 1910.147, Control of hazardous energy - U.S. servicing and maintenance safety requirements.
- OSHA interpretation for cleanup and sanitizing in meatpacking machinery - food-industry application of safeguarding and energy-control requirements.
Cost accounting and legal requirements differ by organization and jurisdiction. Finance, operations, food safety and maintenance should approve the calculation boundary.